Observability With Datadog
14 Dec 2023 - sj, tags: archiving, insights, news, product
Observability (o11y) relies on 3 pillars:
- logs
- metrics
- traces
In this article we’ll see how to achieve observability using Datadog. We’ll use archive.example.com as our hostname, be sure to use your archive’s hostname.
Prerequisites
You have a datadog subscription and you have the DD_API_KEY value.
Install Datadog Agent
DD_API_KEY=XXXXXXXXXXXXXXXXXXXXXXXXXXXXXXXX \
   DD_SITE="datadoghq.com" \
   DD_APM_INSTRUMENTATION_ENABLED=host \
   bash -c "$(curl -L https://s3.amazonaws.com/dd-agent/scripts/install_script_agent7.sh)"
Configure traces
Edit /etc/php/8.1/fpm/pool.d/www.conf, and append the below variables:
env[DD_ENV] = archive.example.com
env[DD_SERVICE] = piler
Add datadog instrumentation to PHP:
curl -LO https://github.com/DataDog/dd-trace-php/releases/latest/download/datadog-setup.php
php datadog-setup.php --php-bin=all
systemctl restart php8.1-fpm
Configure Logs
Let the dd-agent have read permissions on the mail.log file:
chmod 644 /var/log/mail.log
Create /etc/datadog-agent/conf.d/piler.d/conf.yaml with the following content:
logs:
  - type: file
    path: /var/log/mail.log
    service: piler
    source: piler
Configure Metrics
Edit /etc/piler/config-site.php and add the following variable:
$config['ENABLE_PROMETHEUS_METRICS'] = 1;
Create /etc/datadog-agent/conf.d/openmetrics.d/conf.yaml with the following content:
init_config:

instances:
  - prometheus_url: 'https://archive.example.com/metrics'
    namespace: 'piler'
    metrics:
      - 'piler_rcvd': 'piler_rcvd'
      - 'piler_size': 'piler_size'
      - 'piler_ssize': 'piler_ssize'
      - 'piler_ram_bytes': 'piler_ram_bytes'
      - 'piler_disk_bytes': 'piler_disk_bytes'
      - 'piler_smtp_response_time': 'piler_smtp_response_time'
      - 'piler_error_emails': 'piler_error_emails'
      - 'piler_sphx': 'piler_sphx'
Restart datadog agent
systemctl restart datadog-agent
Check Datadog GUI
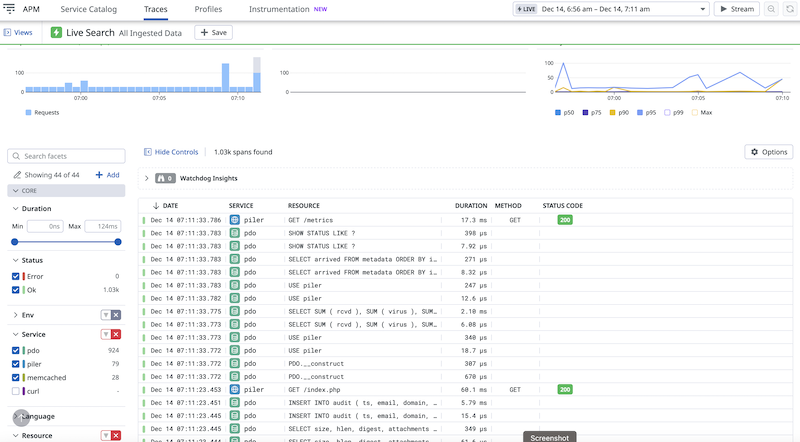
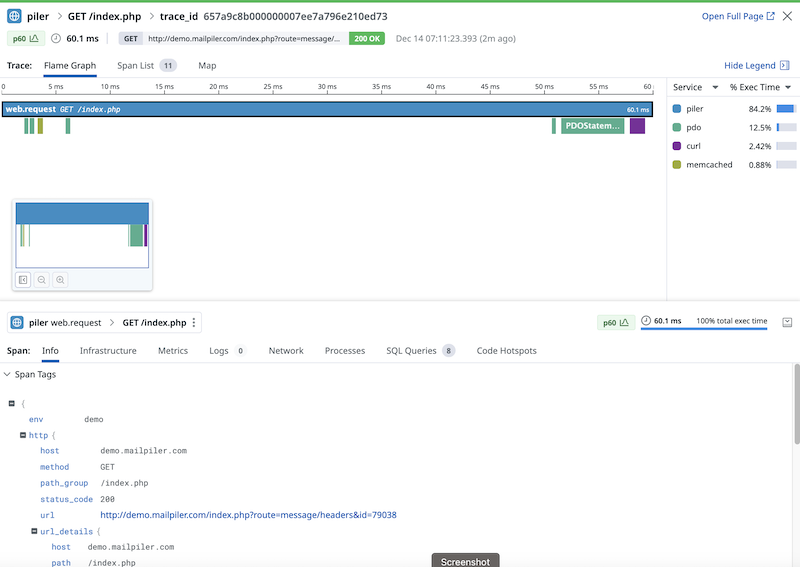
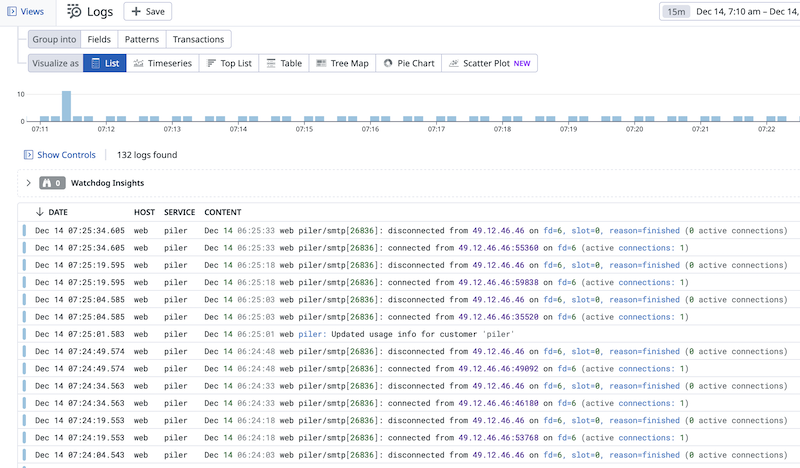
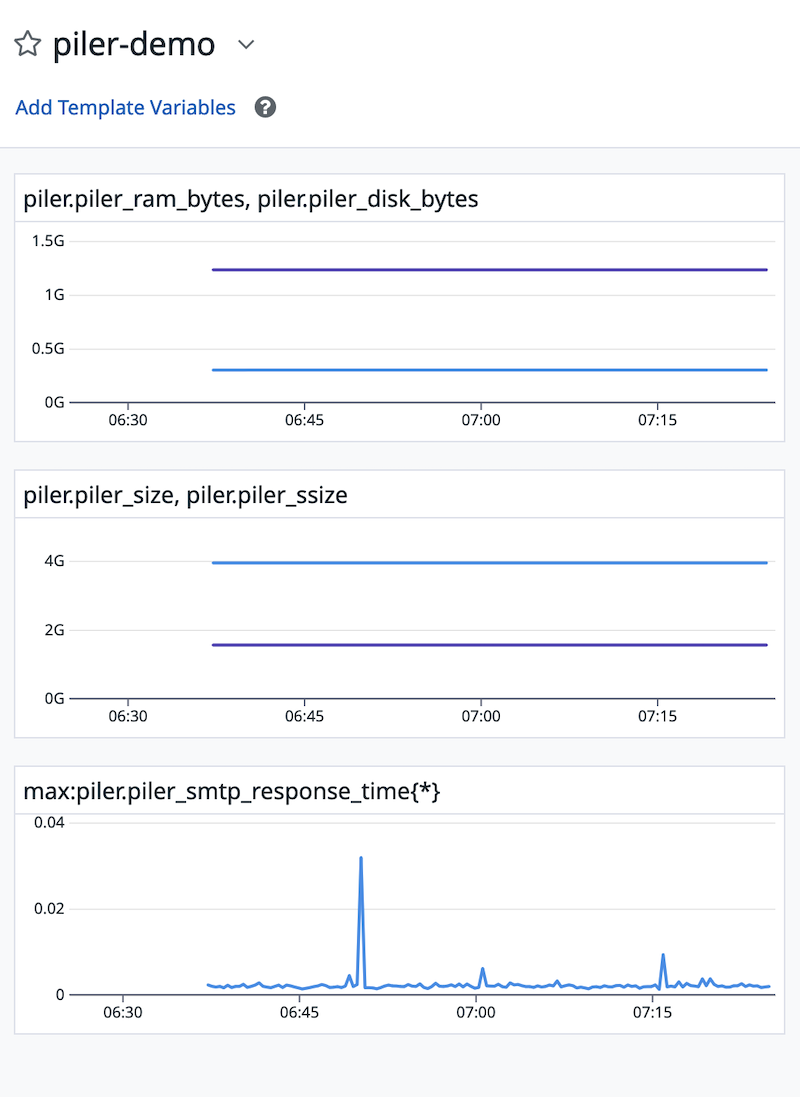
At this point dd-agent sends logs, metrics and traces to Datadog. See a few examples below.
Traces:


Logs:

Metrics:


