Observability With Grafana Cloud
14 Dec 2023 - sj, tags: archiving, insights, news, product
Grafana cloud is a worthy candidate for observability. It offers Grafana for dashboards and metrics, Loki for logs, and Tempo traces. It also has a meaningful free plan to get you started.
In this article we’ll see how to achieve observability using Grafana cloud. We’ll use archive.example.com as our hostname, be sure to use your archive’s hostname.
Also we use 123456 as the grafana username, and XXXXXXXXXXXXXXXXXXXX as the API key. Be sure to use your username and your API key, as well as the prometheus and tempo urls for your subscription.
Prerequisites
You have a Grafana cloud account.
Install Grafana agent
mkdir -p /etc/apt/keyrings/
wget -q -O - https://apt.grafana.com/gpg.key | gpg --dearmor | tee /etc/apt/keyrings/grafana.gpg > /dev/null
echo "deb [signed-by=/etc/apt/keyrings/grafana.gpg] https://apt.grafana.com stable main" | tee /etc/apt/sources.list.d/grafana.list
apt-get update && apt-get install grafana-agent
Edit /etc/grafana-agent.yaml:
server:
  log_level: warn

metrics:
  global:
    remote_write:
      - url: https://prometheus-prod-24-prod-eu-west-2.grafana.net/api/prom/push
        basic_auth:
          username: 123456
          password: XXXXXXXXXXXXXXXXXXXX
    scrape_interval: 1m
  wal_directory: '/var/lib/grafana-agent'
  configs:
    - name: archive.example.com
      scrape_configs:
        - job_name: archive
          scheme: http
          static_configs:
            - targets: ['archive.example.com']

integrations:
  agent:
    enabled: true
  node_exporter:
    enabled: true
    include_exporter_metrics: true
    disable_collectors:
      - "mdadm"

traces:
  configs:
  - name: default
    remote_write:
      - endpoint: tempo-prod-10-prod-eu-west-2.grafana.net:443
        basic_auth:
          username: 123456
          password: XXXXXXXXXXXXXXXXXXXX
    receivers:
      zipkin:
        endpoint: localhost:9411
Install promtail
wget https://github.com/grafana/loki/releases/download/v2.9.3/promtail_2.9.3_amd64.deb
dpkg -i promtail_2.9.3_amd64.deb
Edit /etc/promtail/config.yml
server:
  http_listen_port: 0
  grpc_listen_port: 0

positions:
  filename: /tmp/positions.yaml

clients:
  - url: https://123456:XXXXXXXXXXXXXXXXXXXX@logs-prod-012.grafana.net/loki/api/v1/push

scrape_configs:
  - job_name: piler
    static_configs:
      - targets:
          - localhost
        labels:
          job: archive.example.com
          __path__: /var/log/mail.log
The restart the promtail service
systemctl restart promtail
Configure piler to enable observability
Edit /etc/piler/config-site.php, and set the following:
$config['ENABLE_TRACING'] = 1;
$config['TRACING_HOST'] = 'archive.example.com';
$config['TRACE_COLLECTOR_URI'] = 'http://127.0.0.1:9411/api/v2/spans';
$config['ENABLE_PROMETHEUS_METRICS'] = 1;
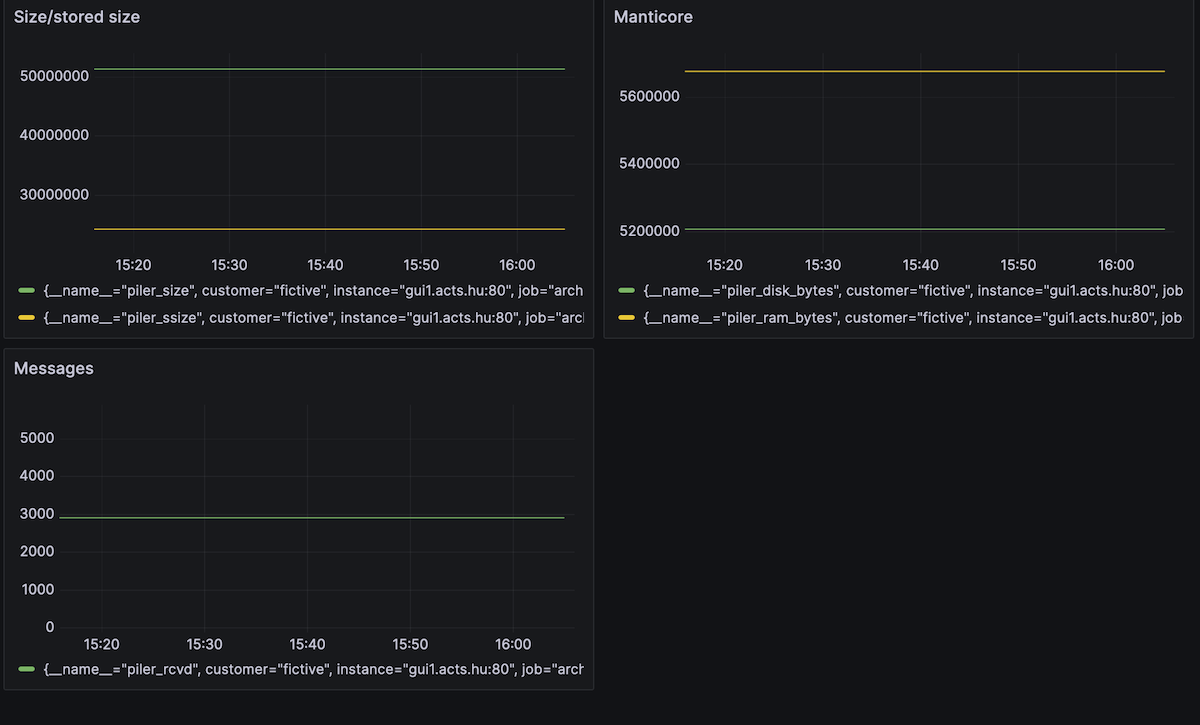
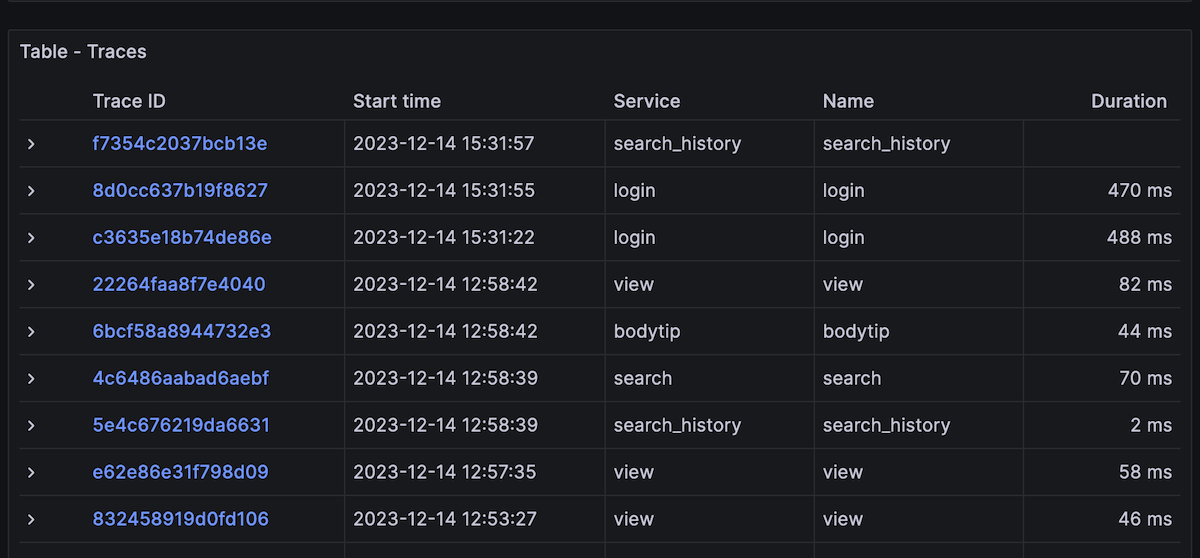
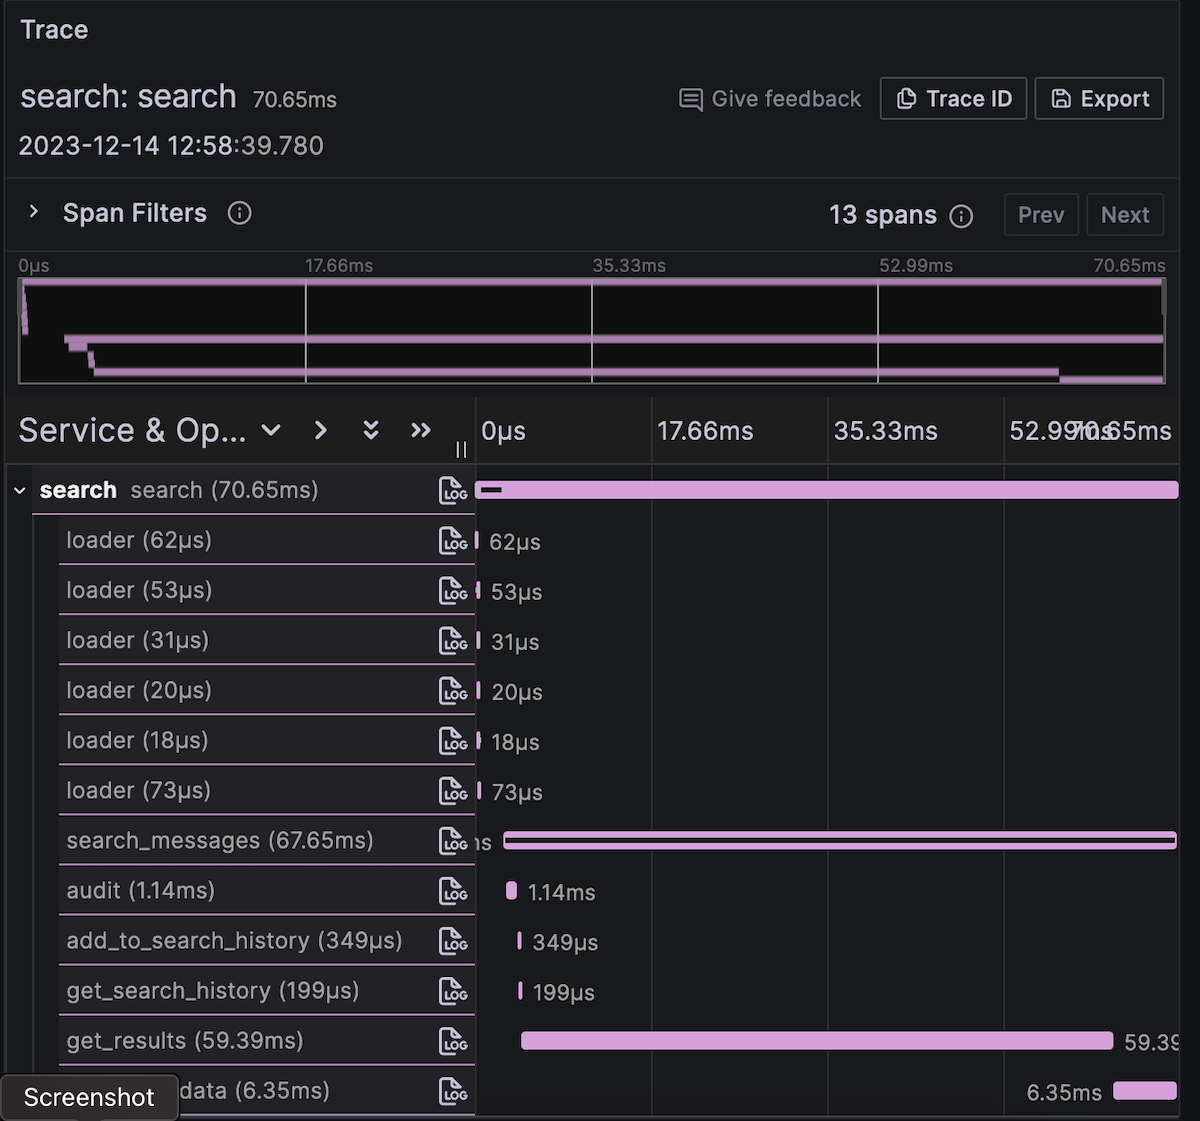
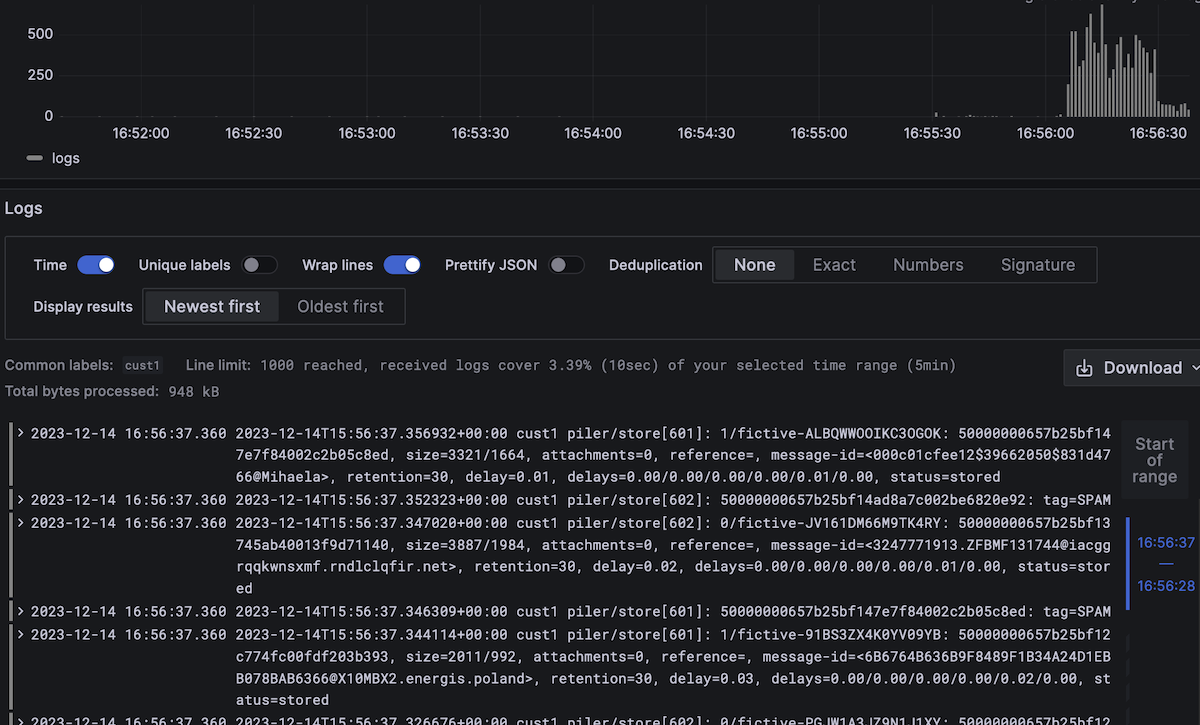
Check your Grafana dashboard
Traces:
Logs:
Metrics: